Instagram Engagement Rate: What's Good and How to Calculate It (UK, 2026 and 2027)
What is a good Instagram engagement rate? Brands average about 0.5%, creators 1% to 6%. Learn which benchmark fits you and how to calculate your own rate.
In this article
Quick answer: Your Instagram engagement rate is likes, comments, saves and shares, divided by the number of posts, divided by followers, times 100. For most UK creators, 1% to 3% is average, 3% to 6% is high and anything over 6% is very high. Brand accounts average closer to 0.5%, so compare yourself with accounts like yours.
One website tells you 0.5% is healthy. Another says anything under 5% means your audience has gone cold. They can't both be right for you.
Brands use this one number to decide whether to pay you, yet most free benchmarks measure different accounts with different formulas. Below, we untangle the three benchmark worlds, show the formula that fits you, and explain how to keep your likes in step with your audience. Our free Instagram engagement rate calculator does the maths.
What is a good engagement rate on Instagram?
A good engagement rate on Instagram is between 1% and 3% for most accounts measured by followers, and anything above 3% is strong. Those are the bands our calculator uses. They reflect a general industry guide, because Instagram itself has never published a "good" number.
| Engagement rate (by followers) | Band | What it usually means |
|---|---|---|
| Under 1% | Low | Posts reach followers who rarely interact, or the content misses the audience |
| 1% to 3% | Average | A healthy, typical account |
| 3% to 6% | High | An engaged audience that likes, comments, saves and shares regularly |
| Over 6% | Very high | Common on small, close-knit accounts; worth checking it holds across posts |
Table: Engagement rate bands from the Mega Followers Instagram engagement rate calculator.
Size changes everything. Small accounts run higher rates because their followers are often friends, regulars or genuine fans who see most posts. As an account grows, more followers drift into the passive category: they followed once, never unfollowed and now scroll straight past. The rate falls even when the content gets better.
Here's an illustrative example. Imagine a Manchester café with 4,000 followers that averages 96 interactions per post across its last ten posts. That works out at 2.4%, a perfectly good result for a local business. Put the same 96 interactions on an account with 40,000 followers, though, and the rate drops to 0.24%, which would look weak to any brand.
So is 3% good? Yes, for nearly every account, and for anyone above 100,000 followers it's a figure most brands would love to see in a media kit.
Is 10% good? It's excellent if it holds across many posts, but check the context first. One viral post, or a tiny account with 300 followers, can produce a very high figure that doesn't say much on its own.
Low rates don't always mean poor content either. If you've grown fast through Reels that reach non-followers, your follower count can climb faster than interactions per post, and that drags the by-followers figure down for a while. Watch the trend over several months before you panic about one quiet week.
Business accounts and personal creator accounts also behave differently. Shops and salons tend to attract followers who want offers and opening times, and those people interact less than fans of a person. If you run a business page, the brand figures in the next section are a fairer comparison than a creator's media kit.
Why "good" Instagram engagement rates disagree by 10x
Benchmarks disagree because they measure different accounts and divide by different numbers. Line up three popular sources and you'll find figures from about 0.5% to more than 6%, all labelled "average".
Brand studies produce the low figures. Socialinsider's Q3 2026 benchmarks analysed more than 67 million posts from brands with between 1,000 and 1 million followers. Reels averaged 0.48% per post. Carousels managed 0.50%, while images trailed at 0.35%.
Their formula counts only likes and comments, divided by followers, which leaves out saves and shares entirely. That matters more than it sounds when you set your own figure beside theirs.
Creator tier tables produce the high figures. Influencer-marketing tools that track personal accounts publish them, and they typically show nano creators with 1,000 to 10,000 followers averaging somewhere around 4% to 5%, sliding to 1% or 2% for accounts with hundreds of thousands of followers. Methods vary, and the tools rarely publish them in full, so treat these tables as rough guides.
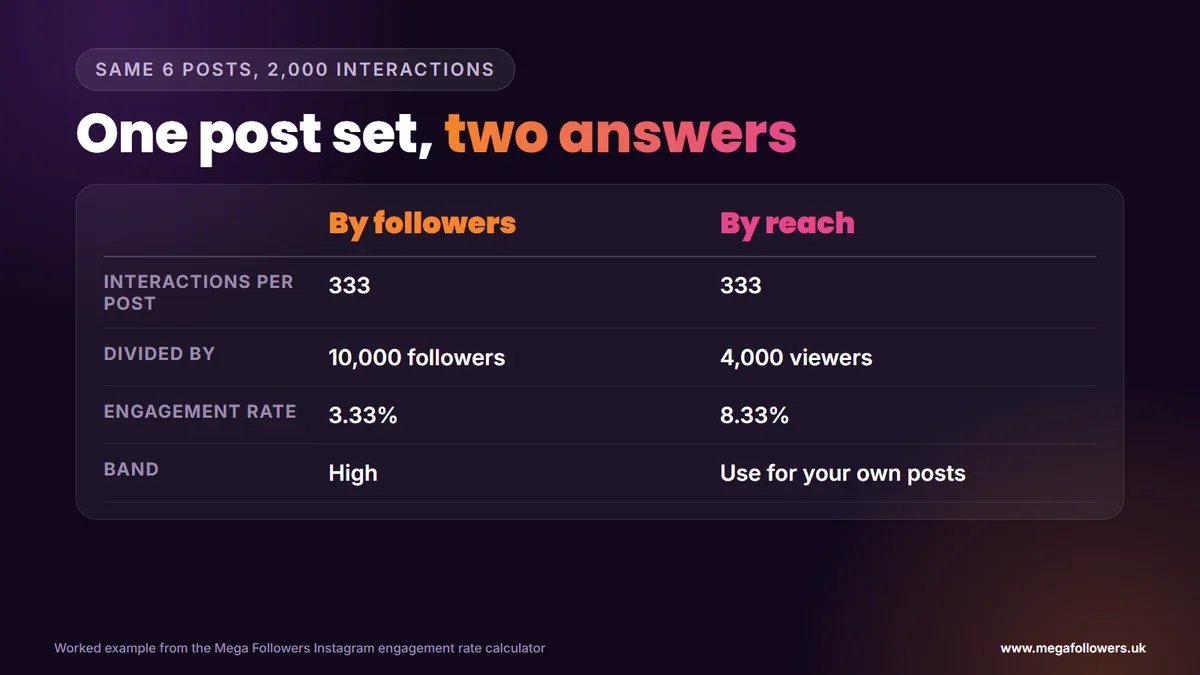
Then there's the denominator problem. Divide the same interactions by reach instead of followers and the percentage jumps, sometimes dramatically. Our calculator page shows it with one worked example: six posts with 2,000 interactions in total, on an account with 10,000 followers, gives 3.33% by followers. Use an average reach of 4,000 accounts per post instead and those posts score 8.33%.
| Benchmark type | Who's measured | Divided by | Typical figure | Use it when |
|---|---|---|---|---|
| Brand studies | Company accounts, 1,000 to 1M followers | Followers (likes + comments only) | About 0.35% to 0.5% | You run a business page and want an industry comparison |
| Creator tier tables | Personal and creator accounts, grouped by size | Followers (usually all interactions) | 1% to 6%, higher for nano accounts | You're a creator checking your standing with brands |
| Reach-based rate | Your own posts | Reach (Viewers) | Often double the follower rate or more | You're judging which of your own posts worked |
Table: Three kinds of Instagram engagement benchmark and when each one applies.
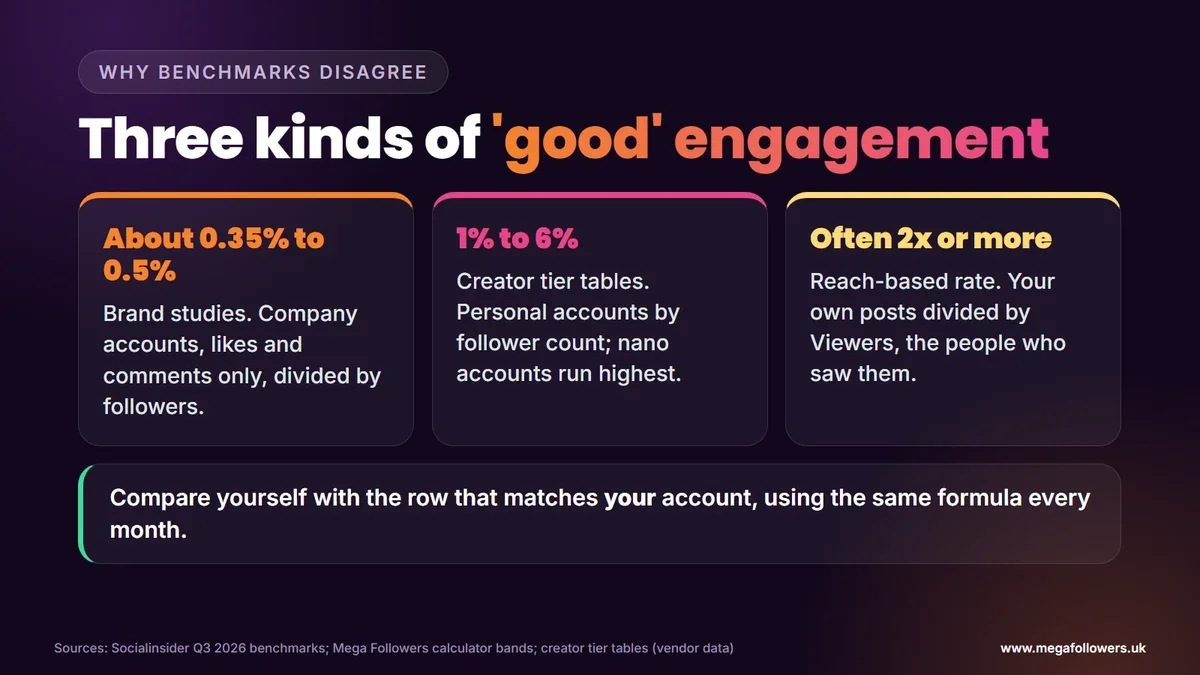
None of these is wrong. Each answers a different question. Trouble starts when someone takes a reach-based figure from a creator's media kit and sets it against a follower-based brand median, or judges a five-person bakery against a celebrity.
Small differences in the things each study counts add up too. Because brand studies leave out saves and shares, your own all-interactions figure will always look a little better than theirs on paper. If saves and shares make up a fifth of your interactions, for example, a 2% rate on your formula is roughly 1.6% on theirs.
Our advice is simple. Pick the row that matches your account and calculate your own rate with the same formula every month. When you share it with a brand, say which formula you used. Your own trend line, measured consistently, tells you more than any industry average ever will.
How to calculate engagement rate on Instagram
To calculate engagement rate on Instagram, add up the interactions on recent posts, divide by the number of posts, divide by your followers and multiply by 100. It takes five minutes with a notepad, or a few seconds with the calculator.
- Pick your posts. Choose your last 6 to 12 feed posts or Reels. Skip anything under 48 hours old, because interactions keep arriving for a couple of days.
- Add up the interactions. Total the likes, comments, saves and shares across those posts. Saves and shares sit in each post's insights.
- Divide by the number of posts. This gives you average interactions per post.
- Divide by your follower count. Use your follower count today.
- Multiply by 100. That's your engagement rate by followers.
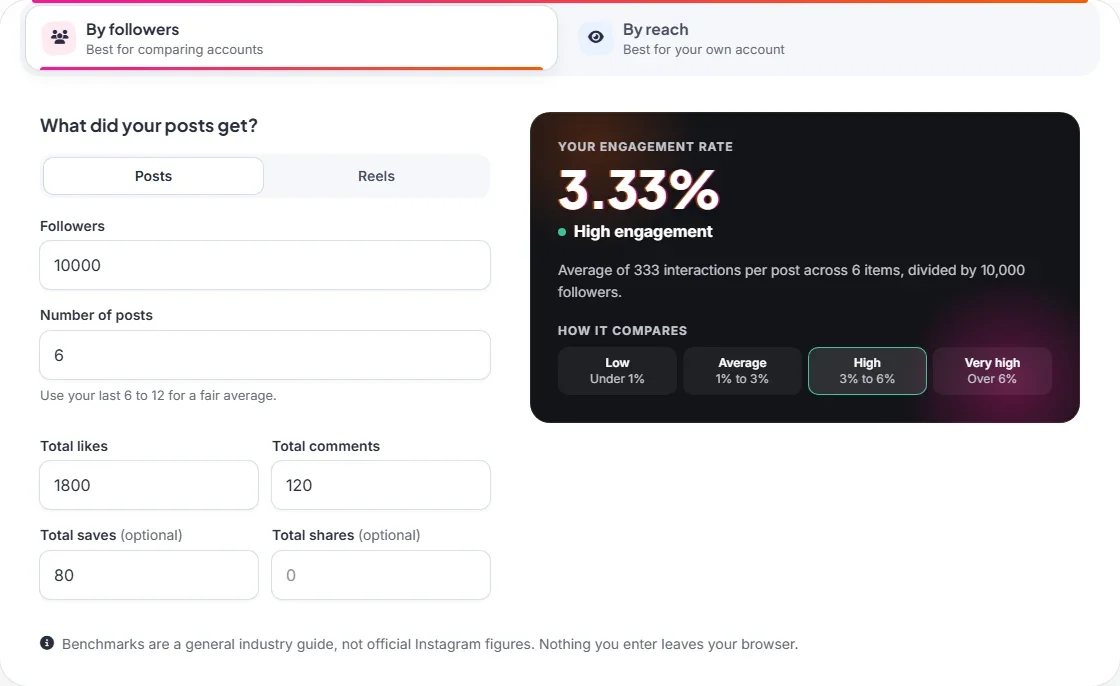
Here's the calculator's worked example in full. Six posts earned 1,800 likes, 120 comments and 80 saves, making 2,000 interactions. That's about 333 per post, and 333 divided by 10,000 followers, times 100, gives 3.33%: high, on our bands.
The reach version swaps the follower count for average reach per post. On Reels, Instagram's insights now call reach "Viewers", which it defines as the number of unique accounts that saw the content on screen at least once. With an average of 4,000 viewers per post, the same example becomes 333 ÷ 4,000 × 100, or 8.33%.
Video-heavy accounts can use a third version: engagement rate by views. Divide interactions by total views and multiply by 100. Because views include replays, this figure usually comes out lowest of the three, which is fine as long as you compare like with like.
Take a second illustrative example. A London hairstylist posts eight Reels in a month, with 960 interactions and 48,000 views in total on an account of 6,000 followers. By views, that's 960 ÷ 48,000 × 100 = 2%. By followers, it's 120 interactions per Reel ÷ 6,000 × 100, which is also 2%.
When the two match like this, most of the stylist's views are coming from followers. A push for reach is the next job.
Some people calculate each post separately and then average the percentages. That works too, though one huge post skews the result less when you total everything first. Whichever method you choose, write it down, because six months from now you'll want to compare honestly.
Should saves and shares count? We think so. Older formulas used only likes and comments, and some brand studies still do.
But a save or a share takes far more effort than a double tap, because someone has decided your post is worth keeping or worth showing to a friend. Instagram's ranking also pays close attention to shares, as the ranking section further down shows in Meta's own words. Leave them out and you undercount the interactions that matter most.
Should you include Reels and feed posts together? You can, but you'll get a cleaner picture by working them out separately first, because a Reel that reaches thousands of non-followers and a carousel seen mostly by followers are doing different jobs. Combine them only for the single headline figure you share with brands, and mention the mix you used.
Keeping a simple spreadsheet makes all this painless. Give each post one row with columns for date, format, likes, comments, saves, shares, views and viewers, then let a formula cell do the division. After three months you'll see which formats and topics lift your rate, and that's worth more than the headline number.
Followers, reach or views: which formula should you use?
Use followers when you compare accounts, because follower counts are public and anyone can check them. Brands vetting creators almost always do it this way.
Use reach (Viewers) for your own content decisions. It includes only accounts that saw the post, so it shows how convincing the content was to the people it reached. A post with a high reach-based rate deserves a sequel.
Views suit Reels-first accounts, where views are the headline metric and reach can be hard to compare across formats. One rule beats all three: don't switch formulas halfway through a report.
Instagram swapped impressions for Views. Here's what that does to your rate
Instagram replaced impressions with Views as its main measure of how often people see content, and that quietly broke a lot of older engagement maths. Views became the primary metric in August 2024. Then, according to Meta's developer update, the legacy impressions and plays metrics left the Insights API on 21 April 2025.
As of November 2026, the post insights screen in the app lists Views, Interactions and Profile activity. On Reels, Views means the number of times a reel starts to play or replay, so one keen viewer can count several times.
That has two consequences for anyone tracking engagement. Both catch people out:
- Old impressions-based rates don't compare with new views-based ones. Views tend to run higher, so a rate calculated on views usually looks lower than the 2024 equivalent, even when the content performed the same.
- Third-party tools changed their formulas at different times. A report from early 2025 and one from late 2026 may use different denominators under the same "engagement rate" label.
Here's an illustrative example of the gap. A reel with 12,000 views from 8,000 viewers and 400 interactions scores 3.3% by views. By viewers, it scores 5%. Same reel, same audience, and a 1.7-point difference purely from the choice of denominator.
The change hit creators who quote rates in media kits hardest, because a brand comparing two kits can't tell whether one uses old impressions, new views or reach unless the creator says so. If you update your kit, add a short line such as "engagement rate by followers, last 12 posts, November 2026". It takes ten seconds and removes any doubt.
Plenty of guides still list "engagement rate by impressions" as a current option. For organic Instagram content, the app no longer shows that number. If you have old reports built on impressions, keep them for reference, but restart your trend line from the switch.
The fix is easy. Pick followers, Viewers or views, note the date you started, and stick with it through 2027.
Instagram engagement rate by account size and format
Engagement rate falls as accounts grow, and it varies by format, with carousels narrowly ahead in 2026. Socialinsider's Q3 2026 figures for brand accounts show how close the formats sit:
| Format | Average engagement rate per post, Q3 2026 | Change |
|---|---|---|
| Carousels | 0.50% | Holding the lead |
| Reels | 0.48% | Flat on the quarter |
| Images | 0.35% | Up from 0.33% |
Table: Instagram engagement rate by format for brand accounts (likes and comments ÷ followers), from Socialinsider's Q3 2026 benchmarks.
The gaps are small, and they hide a trade-off. Reels reach far more non-followers than carousels do. That's great for growth, but those viewers aren't in your follower count, so their likes inflate the by-followers figure on some Reels and vanish on others. Carousels mostly reach existing followers and invite swiping and saving, which produces steadier rates.
Comments tell a slightly different story. Socialinsider also counts average comments per post by brand size, and Reels win at every tier. Brands with 10,000 to 50,000 followers, for instance, average 12 comments per Reel, 10 per carousel and 4 per image.
Size works in the other direction. Picture a 2,000-follower personal account sitting at 5% because most followers know the person. A 200,000-follower account with the same content quality might sit at 1.5%, because its audience is broader and more casual. Neither is failing.
This is also why follower count and engagement rate should be read together rather than separately. A brand looking at a 200,000-follower profile on 1.5% sees roughly 3,000 interactions a post, while the 2,000-follower account on 5% delivers around 100. So the smaller account has the better rate, the larger one has the bigger audience, and most campaigns need some of both.
Niche matters as well. Communities built around a shared passion, such as a sports club, a university or a hobby, tend to interact more than audiences who follow for deals. Discount-led retail accounts will rarely match a local football club's rate, and it doesn't need to.
What should a growing UK account do with all this? Use Reels to reach new people and carousels to deepen engagement with the people you already have. Measure each format separately.
When your follower count jumps, expect the rate to dip for a few weeks before it settles. Our guide to growing your Instagram followers covers the growth side step by step.
How to find your engagement numbers in Instagram Insights
You'll find every number you need under View insights on each post or reel. You need a public account, personal or professional, and insights stay available for up to two years.
Checking a feed post takes three taps. Here's the route:
- Tap your profile picture in the bottom right to open your profile.
- Tap the post you want to check.
- Tap View insights.
The post screen shows Views, Interactions and Profile activity. Instagram defines Interactions as actions such as likes, comments, saves and shares, which is exactly the total our formula needs. For reels, open the Reels tab on your profile, pick a reel and tap View insights. You'll see Views, Watch time, Viewers, Average watch time and Follows, as set out on Instagram's reel insights help page.
Professional accounts also get an account-level dashboard with totals across a date range. It's handy for monthly checks, though the per-post route gives you cleaner averages.
Instagram labels Viewers as an estimated, in-development metric. It's fine for spotting trends. Don't quote it to the decimal point in a pitch.
A few habits make the numbers more reliable. Check insights at the same point after posting, say seven days, so every post has had the same time to collect interactions. Note the format and topic beside each figure. And screenshot the insights for your best posts as you go, because brands will ask for them and older posts are easy to lose track of.
Average watch time deserves a place in your spreadsheet too. It isn't part of the engagement rate formula, but it's the clearest number Instagram gives you for "time spent", one of the reactions its ranking predicts.
What to do when an account hides its likes
Anyone can hide like counts on posts they see, and creators can hide like and view counts on their own posts before sharing. The owner still sees their own totals.
That makes the by-followers formula impossible from the outside. When you're vetting an account with hidden likes, calculate a comments-only rate as a rough guide, or ask the creator for insights screenshots. Any creator serious about brand work will share them.
If you hide your own likes, keep a set of screenshots ready so brands don't have to ask twice. Include the date on each one, and pick a typical post as well as your best, because experienced marketers trust a range more than a highlight reel.
What Instagram's ranking looks at
Instagram's ranking predicts how people will react to a post, and the reactions it names go well beyond likes. Meta's ranking explanation for Feed, updated on 29 June 2026, lists the predictions Instagram uses to order posts. Among them:
- How likely you are to enjoy the post, which draws on positive actions such as liking, commenting and resharing.
- How likely you are to share it with someone in a direct message.
- How much time you're likely to spend on it.
- How likely you are to skip it.
- How likely you are to swipe through a whole carousel.
- How long you're likely to spend on the author's profile afterwards.
Look closely at that list. Sharing by DM gets its own line, and so does time spent, while skipping counts against you. Likes feed just one prediction among many.
That's the strongest argument for counting shares and saves in your engagement rate. A post that people send to friends is doing exactly what Instagram rewards, even if its like count looks modest. When you review your posts, sort them by shares and saves as well as likes, and you'll often find a different "best post".
You can map most of these predictions onto numbers you already see. Shares and comments sit in Interactions. Time spent shows up as average watch time on Reels. Profile activity on a post tells you how many people went to look at your profile afterwards, which lines up with the last prediction on the list.
Carousels get a prediction of their own as well: how likely people are to swipe through the whole set. That's a good reason to put your strongest point on the last slide and say so on the first, because people who swipe to the end are telling Instagram the post held their attention from start to finish.
Engagement rate still matters, because those actions feed the predictions. Treat it as a summary, and look underneath it at which actions are driving it. For a deeper look at the signals, read our guide to the Instagram algorithm.
Why brands check your engagement rate before your follower count
Brands check engagement because it tells them whether your followers are paying attention. A marketing manager can divide your recent likes and comments by your follower count in under a minute, and many use tools that do it automatically.
Healthy ratios say the audience is real and watching. Big followings with very thin engagement raise awkward questions: are the followers inactive, is the content off, or was the audience built in a way that doesn't hold attention? Fair or not, a 50,000-follower account at 0.2% gets fewer offers than a 15,000-follower account at 3%.
Brands increasingly ask for more than the headline figure as well, and UK campaigns in particular often want proof that most of your audience is in Britain before they agree a fee. Expect requests for insights screenshots showing views, viewers and where your audience is based. Have them ready, and state your formula alongside your rate. A short media-kit line that gives your rate, the formula, the number of posts and the month you measured it answers the questions a brand would otherwise have to ask, and it makes you look like someone who understands their own numbers.
So keep growth and engagement in step. When your follower count rises, the likes and comments on your recent posts should rise with it. Steady Instagram comments give brands visible conversation under your posts, and auto-likes on every new post keep each upload looking active from the first hour. Both work as social proof for visitors and brands, alongside the content habits below.
Think of it as presentation. Any profile that has just grown by a few thousand followers but still shows a dozen likes per post looks unfinished, in the same way a new shop with empty shelves does. Matching the likes and comments to the audience size makes the account look like what it's becoming.
8 ways to raise your Instagram engagement rate
The fastest way to raise your rate is to make posts people want to save, share and reply to, then show them to the right people at the right time. These eight habits do most of the work.
- Hook in the first second. On Reels, open with the payoff or the problem. On carousels, make the first slide a clear promise. Skips count against you, so the opening frame decides whether anyone stays long enough to engage.
- End captions with a specific question. "Which would you order?" beats "Thoughts?" every time, because it gives people something easy to answer. Questions with two clear options work especially well.
- Make carousels worth saving. Checklists, step-by-step guides, price comparisons and before-and-after slides get saved for later. Saves are interactions, and a saved post often gets a second look days later.
- Design for DM sends. Ask yourself who someone would send this to. Relatable moments, local tips and "this is so you" content travel through DMs, and DM shares are one of Instagram's named predictions.
- Reply in the first hour. Early replies keep conversations going and start threads that pull people back. Set a reminder for the hour after you post, and reply with a question where you can.
- Post when your UK audience is online. Check when your followers are active in your account insights, and lean on our guide to the best time to post on Instagram for UK timings in GMT and BST.
- Test one thing at a time. Change the hook, the format or the posting time, never all three at once. Otherwise you won't know what worked, and you'll repeat the wrong lesson.
- Use Stories to warm people up. A poll or question sticker before a big post reminds followers you exist. People who've just tapped a sticker are already in the habit of interacting with you that day.
Give any new habit at least four weeks before you judge it. Engagement moves slowly, and one post proves very little.
Mistakes that make your engagement rate look wrong
Most "my engagement rate is terrible" panics come from measurement mistakes rather than bad content. Check these before you change anything.
- Mixing formulas. Comparing a reach-based figure from one month with a follower-based figure from another makes it look as though engagement halved.
- Including a viral outlier. One post that travelled far beyond your usual reach can double the average. Calculate with and without it.
- Counting brand-new posts. A post from this morning hasn't finished collecting interactions yet.
- Using pre-2025 impressions figures. The metric no longer exists in the app, so old and new numbers won't line up.
- Comparing a business page with a personal creator account. They live in different benchmark worlds.
- Leaving out saves and shares. You'll undercount the actions Instagram values most.
- Counting your own replies. The comment total on a post includes your replies, so a busy thread can look bigger than it is. For pitches, note roughly how many comments came from you.
- Judging on a single month. Seasonal dips are normal, with summer holidays and the run-up to Christmas both changing when and how much people scroll. Compare the same month year on year once you have the data.
- Using an old follower count. Divide by today's figure. Last quarter's number flatters or punishes you for no reason.
Fix the method first. Then judge the content with numbers you can trust.
Followers open the door. Engagement keeps it open.
Your follower count is the first number anyone sees. It decides whether a visitor takes you seriously and whether a brand opens your media kit at all. Your engagement rate decides what happens after that.
The accounts that land deals in 2026 and 2027 have both: a following big enough to matter and posts that show the audience is listening. Mega Followers helps with the first part through real-looking Instagram followers, delivered gradually, with a 30-day refill guarantee and no password required. Pair that with likes and comments that keep pace, and with the habits above that earn saves and shares.
Then run your numbers through the calculator once a month, using the same formula each time, and watch the trend rather than the day. The figure that matters most is the one you can compare honestly with last month's, because a steady climb of half a point over a few months is worth more in a pitch than one lucky spike.
Questions about orders or delivery? Our FAQs cover most of them, and if not, we'll sort it.
Frequently asked questions
Is a 3% engagement rate good on Instagram?
Yes. A 3% engagement rate by followers sits at the top of the average band and the start of the high band on most creator benchmarks. It's also roughly six times the average for brand accounts in Socialinsider's 2026 data. For accounts above 100,000 followers, 3% is an excellent result.
Is a 10% engagement rate good on Instagram?
It's excellent if it holds steady across many posts. Very high rates are common on small accounts where followers know the person, and on single posts that went viral. Check the figure over 6 to 12 posts, and look at reach, before treating 10% as your normal level.
Does engagement rate affect reach on Instagram?
Indirectly, yes. Instagram doesn't rank posts on an engagement rate percentage, but its ranking predicts how likely people are to enjoy, share, skip or spend time on a post. Those predictions draw on likes, comments, reshares and DM shares, so content that earns those actions tends to reach more people.
Do Reels get a higher engagement rate than posts?
Not always. In Socialinsider's Q3 2026 data for brand accounts, carousels averaged 0.50% and Reels 0.48% by followers, with images at 0.35%. Reels reach more non-followers, which helps growth but makes their follower-based rate less predictable from one video to the next.
Do Story views count in Instagram engagement rate?
Usually not. Most engagement rate formulas use feed posts and Reels only, because Stories disappear after 24 hours and have their own metrics. If you want a Story figure, divide replies, sticker taps and shares by Story views, and keep it separate from your main engagement rate.
How often should you check your Instagram engagement rate?
Once a month is enough for most accounts. Use your last 6 to 12 posts, the same formula every time and the same mix of formats. Weekly checks tend to swing with a single post, while a monthly figure shows the real trend you can act on.